Data & Trends

USCB Data & Trends

Students Walking by Marsh

The Office of Planning, Analytics, and Compliance is responsible for maintaining, analyzing, and publishing data relating to USCB's students, faculty, staff, and educational programs for use in the conduct of official university business.

Per the USC Policy on Private Requests for University Data, "requests for the generation of new data or reports about the institution from private parties or for private use..., in which either the requesting party is not an employee of the university, or the intended use of data is not in pursuit of the conduct of official university business" should contact USCB's Advancement Office at 843.208.8030.

USCB Data Request Form
If you have an urgent data request for a University purpose, please complete the Data Request Form and contact Brian Mallory (ext. 4137) or Kevin Bessent (ext. 4178) to discuss.

To insure privacy of student data, The Office of Planning, Analytics and Compliance and Research is now placing data in a shared space that only you and we can access. Once the Data Request Form is completed, an IER staff member will contact you with procedures on how to access the requested data.

To request a user specific Cognos report, please submit a request with USC at servicedesk@sc.edu.

Data Dashboard

The University of South Carolina Office of Institutional Research, Assessment and Analytics at Columbia has developed a set of Data Dashboards presenting enrollment, degrees awarded and workforce data for the entire system, including the University of South Carolina Beaufort.  The customizable options on each dashboard allow reports for each of the eight UofSC campuses from Fall 2013 to present. Click here to access the Data Dashboards website, choose the type of data you want to display, and then define the campus field to choose "Beaufort".  For your convenience, the site also includes a helpful "Introduction Demo Video".
USCB By the Numbers

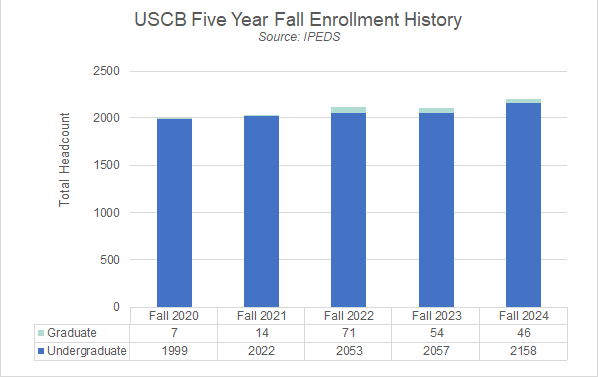
USCB Five Year Fall Enrollment History. Source: IPEDS. Fall 2019: 7 Graduate and 2112 Undergraduate. Fall 2020: 7 Graduate and 1999 Undergraduate. Fall 2021: 14 Graduate and 2022 Undergraduate. Fall 2022: 71 Graduate and 2053 Undergraduate. Fall 2023: 54 Graduate and 2067 Undergraduate.

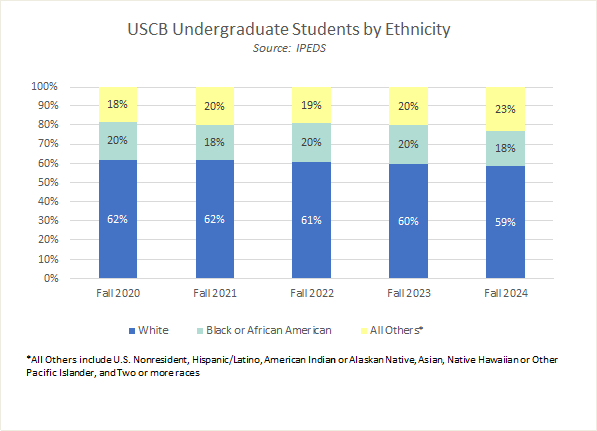
USCB Undergraduate Students by Ethnicity. Source: IPEDS. Fall 2019: 61% White, 21% African American, and 18% All Others*. Fall 2020: 62% White, 20% African American, and 18% All Others*. Fall 2021: 62% White, 18% African American, and 20% All Others*. Fall 2022: 61% White, 20% African American, and 19% All Others*. Fall 2023: 60% White, 20% African American, and 20% All Others*. *All Others include U.S. Nonresident, Hispanic/Latino, American Indian or Alaskan Native, Asian, Native Hawaiian or Other Pacific Islander, and Two or more races.

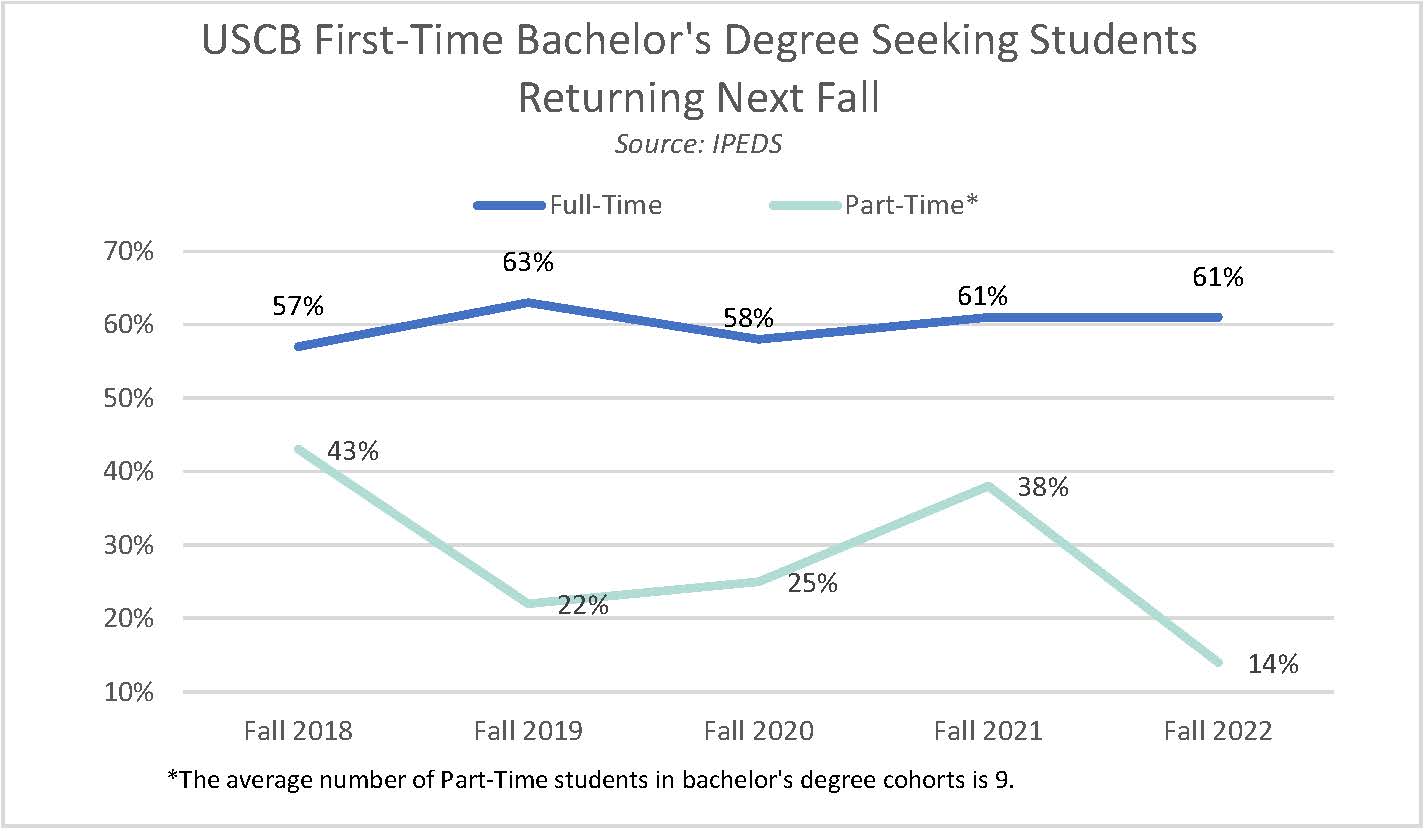
USCB First-Time Bachelor's Degree Seeking Students Returning Next Fall. Source: IPEDS. Fall 2018: 57% Full-Time and 43% Part-Time*. Fall 2019: 63% Full-Time and 22% Part-Time*. Fall 2020: 58% Full-Time and 25% Part-Time*. Fall 2021: 61% Full-Time and 38% Part-Time*. Fall 2022: 61% Full-Time and 14% Part-Time*. *The average number of Part-Time students in bachelor's degree cohorts is 9.

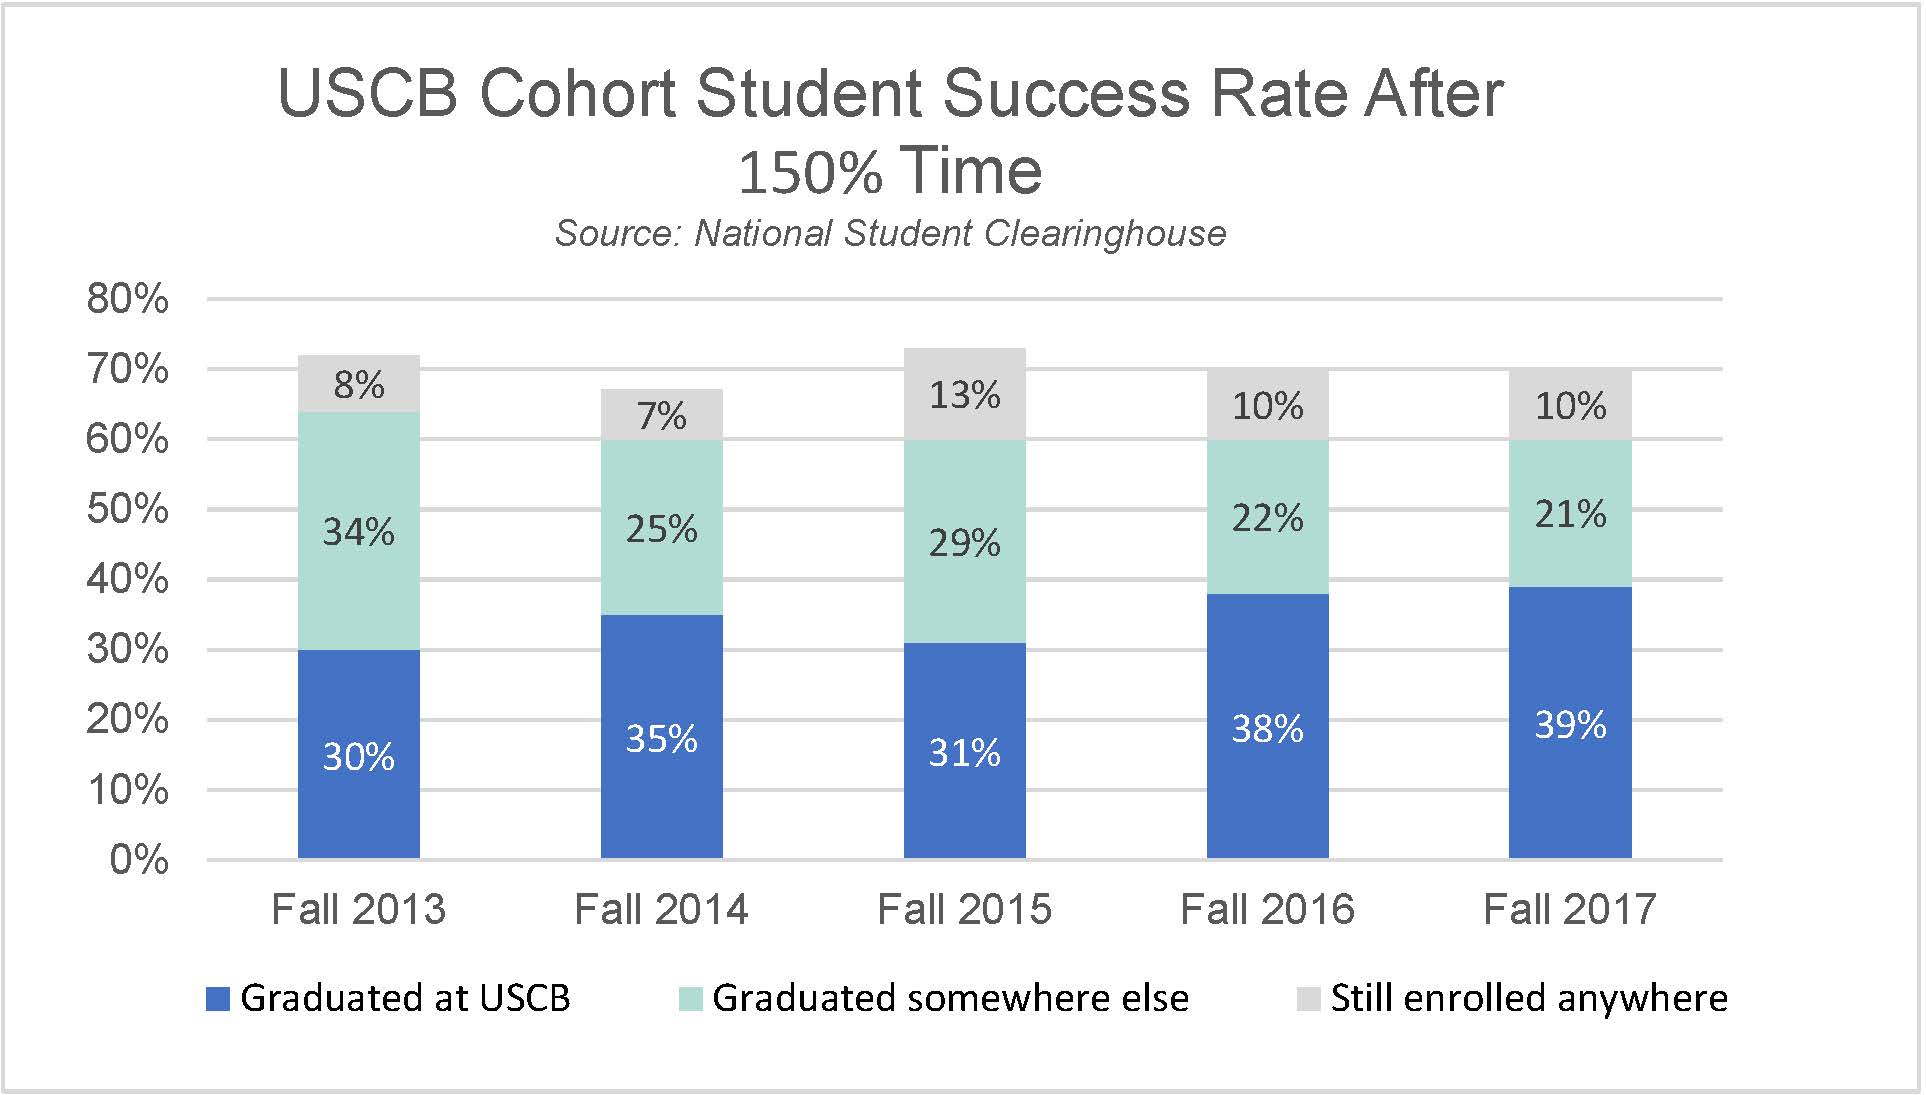
USCB Cohort Student Success Rate After 150% Time. Source: National Student Clearinghouse. Fall 2013: 30% Graduated at USCB, 34% Graduated somehwere else, and 8% Still enrolled anywhere. Fall 2014: 35% Graduated at USCB, 25% Graduated somewhere else, and 7% Still enrolled anywhere. Fall 2015: 31% Graduated at USCB, 29% Graduated somewhere else, and 13% Still enrolled anywhere. Fall 2016: 38% Graduated at USCB, 22% Graduated somewhere else, and 10% Still enrolled anywhere. Fall 2017: 39% Graduated at USCB, 21% Graduated somewhere else, and 10% Still enrolled anywhere.

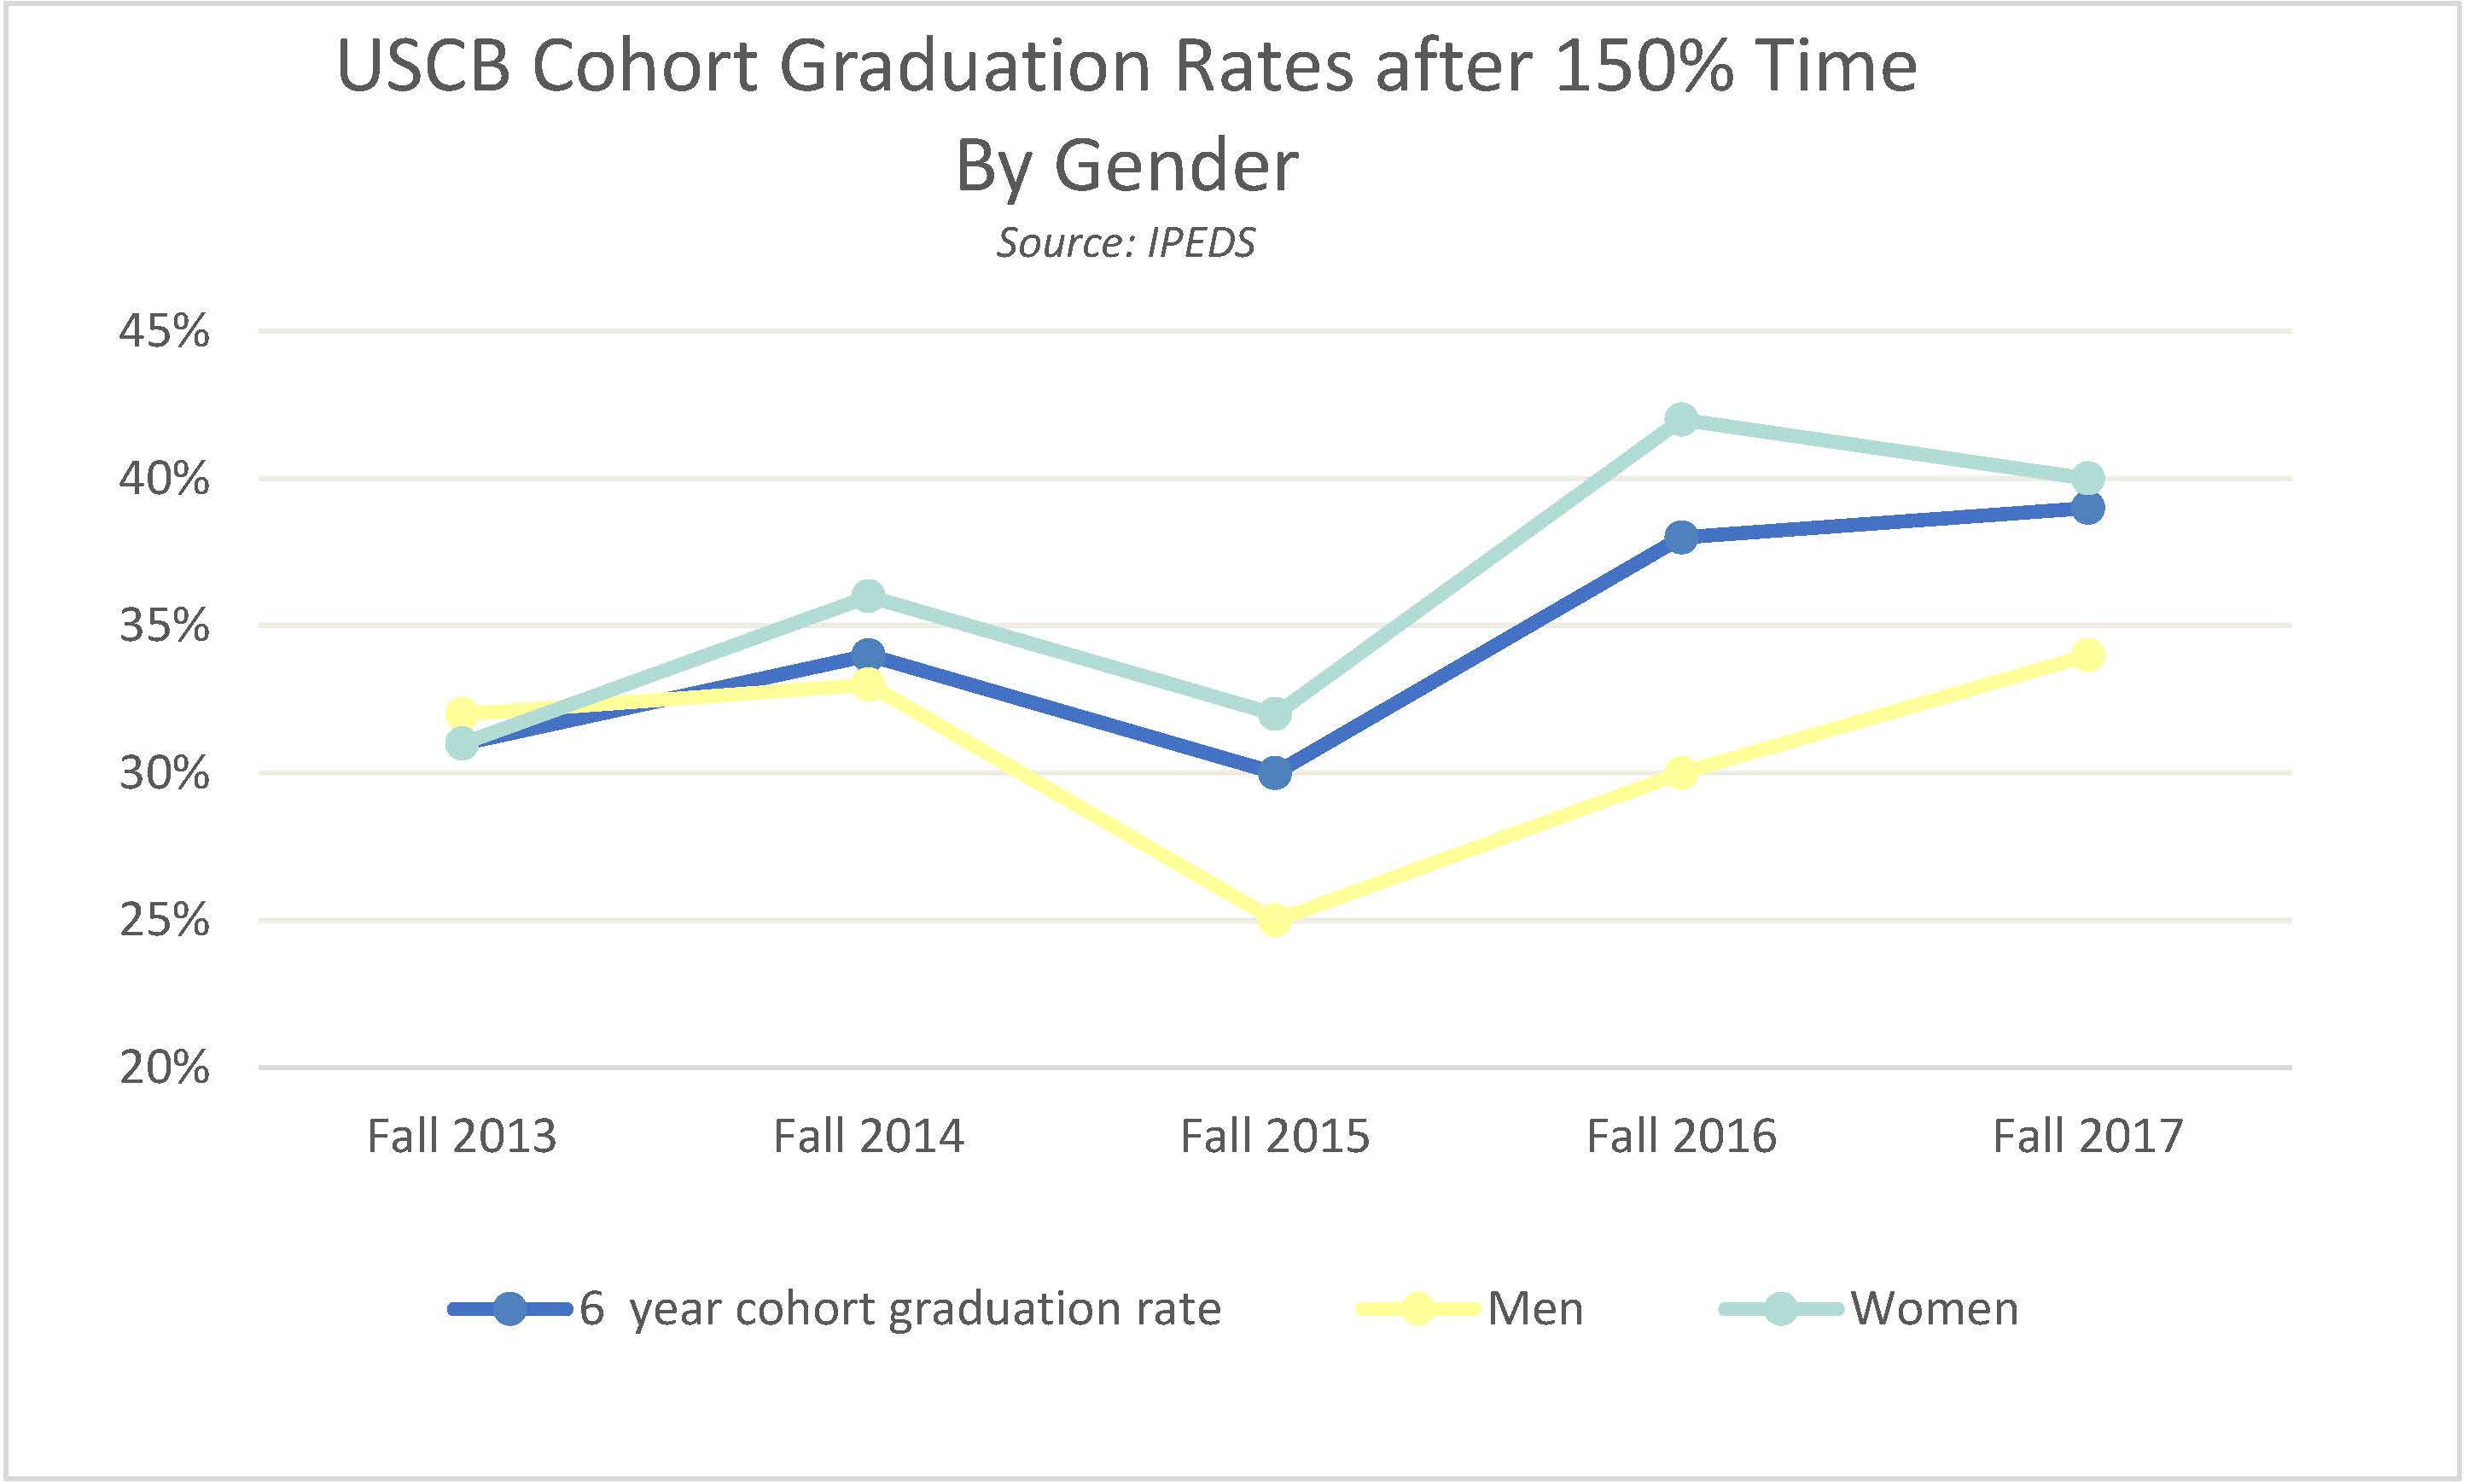
USCB Cohort Graduation Rates after 150% Time By Gender. Source: IPEDS. Fall 2013: 6-year cohort graduation rate, Men, and Women all about 31%. Fall 2014: 6-year cohort graduation rate is about 34%, Men about 33%, and Women about 36%. Fall 2015: 6-year cohort graduation rate is about 31%, Men about 25%, and Women about 33%. Fall 2016: 6-year cohort graduation rate is about 38%, Men about 30%, and Women about 43%. Fall 2017: 6-year cohort graduation rate is about 39%, Men is about 34%, and Women is about 40%.

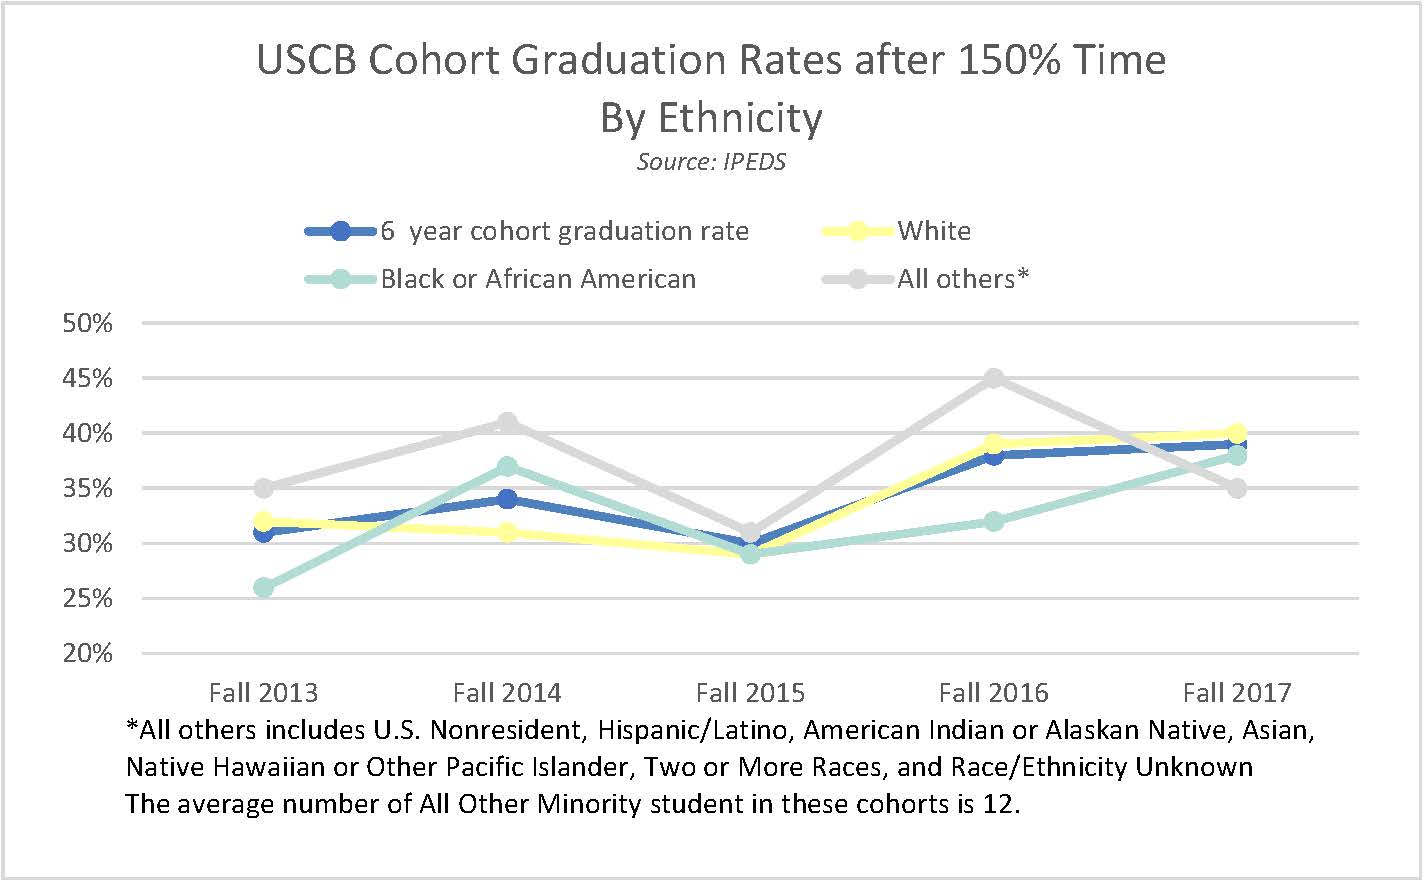
USCB Cohort Graduation Rates after 150% Time By Ethnicity. Source: IPEDS. Fall 2013: 6-year cohort graduation rate is about 31%, White is about 32%, Black or African American is about 26%, and All others* is about 35%. Fall 2014: 6-year cohort graduation rate is about 34%, White is about 31%, Black or African American is about 37%, and All others* is about 41%. Fall 2015: 6-year cohort graduation rate is about 30%, White is about 30%, Black or African American is about 29%, and All others* is about 31%. Fall 2016: 6-year cohort graduation rate is about 38%, White is about 39%, Black or African American is about 33%, and All others* is about 45%. Fall 2017: 6-year cohort graduation rate is about 39%, White is about 40%, Black or African American is about 38%, and All others* is about 35%. *All other includes U.S. Nonresident, Hispanic/Latino, American Indian or Alaskan Native, Asian, Native Hawaiian or Other Pacific Islander, Two or More Races, and Race/Ethnicity Unknown. The average number of All Other Minority student in these cohorts is 12.

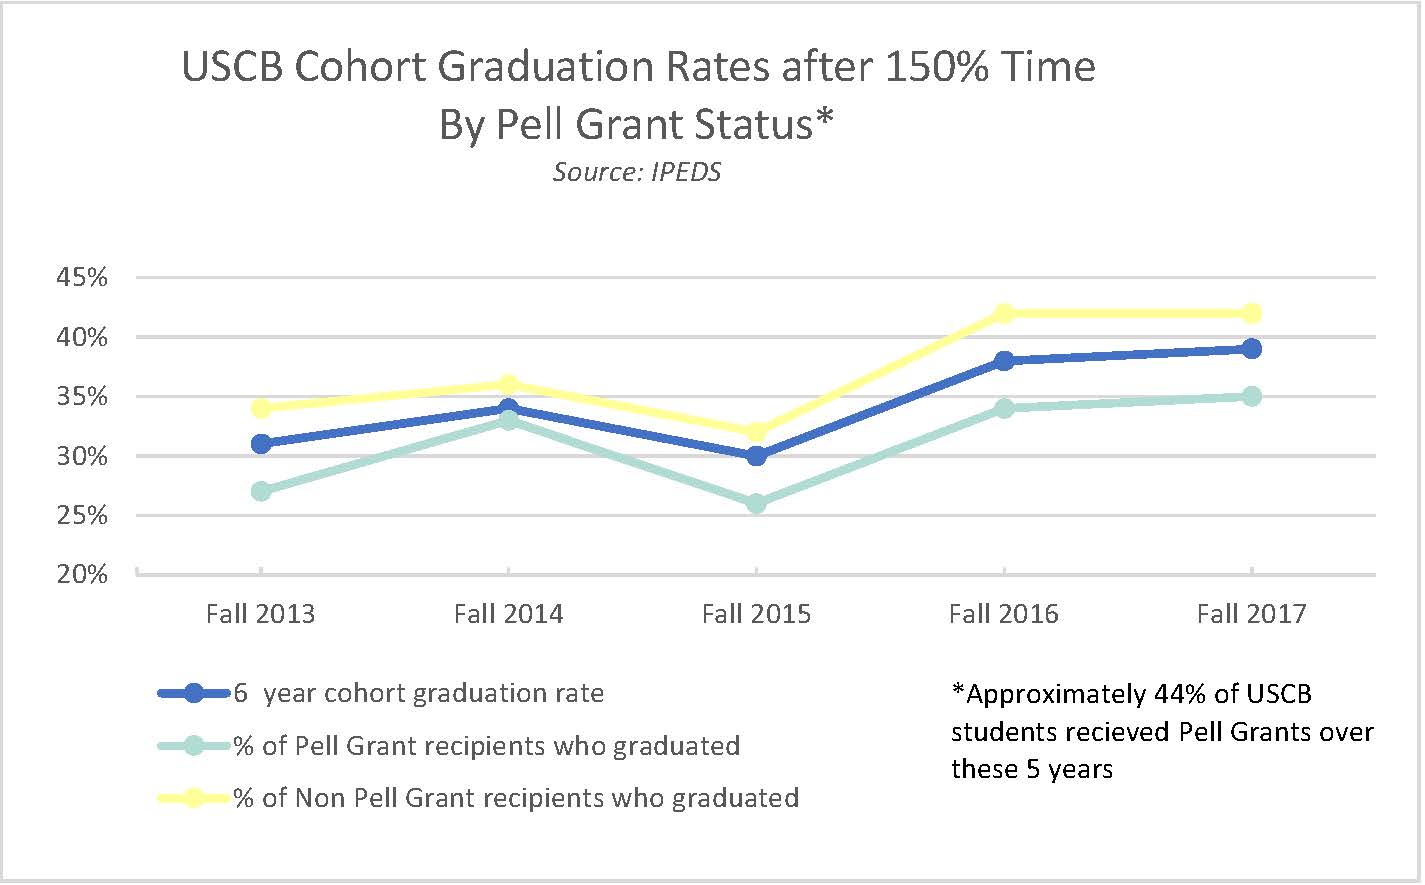
USCB Cohort Graduation Rates after 150% Time By Pell Grant Status*. Source: IPEDS. Fall 2013: 6-year cohort graduation rate is about 31%, percent of Pell Grant recipients who graduated is about 23%, and percent of Non Pell Grant recipients who graduated is about 34%. Fall 2014: 6-year cohort graduation rate is about 34%, percent of Pell Grant recipients who graduated is about 33%, and percent of Non Pell Grant recipients who graduated is about 35%. Fall 2015: 6-year cohort graduation rate is about 30%, percent of Pell Grant recipients who graduated is about 26%, and percent of Non Pell Grant recipients who graduated is about 32%. Fall 2016: 6-year cohort graduation rate is about 38%, percent of Pell Grant recipients who graduated is about 34%, and percent of Non Pell Grant recipients who graduated is about 42%. Fall 2017: 6-year cohort graduation rate is about 39%, percent of Pell Grant recipients who graduated is about 35%, and percent of Non Pell Grant recipients who graduated is about 42%. *Approximately 44% of USCB students received Pell Grants over these 5 years.